How We Trust a Machine to Spend Money Autonomously
We built an autonomous system that makes financial decisions and executes them against live markets with real capital. When it identifies an opportunity, money moves. No human approval. No handholding.
A system like this can't afford subtle failures. A bug doesn't lose a log line, it loses money in seconds. A connection dropout means the system can't execute. A bad deployment? Might cause a thousand unvalidated requests to hit an exchange before anyone notices.
That constraint forced us to treat durability as a set of mechanisms that reinforce each other.
What follows is how we engineered each piece.
Extreme Ownership
Infrastructure is not someone else's problem.
Your deployment infrastructure must live in the same repository as the application code. Every configuration, every environment definition, every deployment procedure is versioned, reviewed, and released alongside the trading logic it runs. Why? Because when code changes, the person who wrote it must be the same person who understands what environment it's running in. There's no "someone in ops will figure it out."
When you ship a code change, the pull request should let you change:
- Compute resources (CPU, memory)
- Auto-scaling thresholds
- Health check timeouts
- Alerting rules and thresholds
- Database migration steps
- etc.
All in one review. All in one deploy. This prevents the most common form of infrastructure drift: code assumptions that don't match the environment because they were written at different times by different teams.
All infrastructure, data stores, message queues, monitoring endpoints, network policies, etc must be declared as code and live in version control. Not in a cloud console. Not in a separate IaC repo. In the same repository, versioned with the application.
Singleton connections and redundant execution
In any autonomous trading system, there are components that must be singular because the protocol forbids duplicate sessions. But if you make the entire system singular (one pod, one worker pool), you've also made it a single point of failure. The moment that pod dies, the system is completely offline.
Leader election
We use Kubernetes' own API server as the coordination layer. No additional etcd, Redis, or MemoryStore cluster. The Lease API (coordination.k8s.io) becomes the source of truth: exactly one pod holds the lease and owns the singleton connection.
When the leader dies, a follower acquires the lease within seconds, fast enough that the protocol times out the dead connection and accepts a fresh one from the new leader without external intervention.
If a newly-elected leader fails during initialization (connection handshake fails, for example), it deliberately releases the lease rather than staying up partially initialized. Fail loudly and hand off beats staying up broken.
Decoupling singularity from scale
The connection must be singular, but the execution layer does not have to be.
Our workflow orchestration runs on every pod, all the time. On the leader, the worker pool is small and reserved for ultra high-priority work, since the leader is also managing the connection. On followers, the worker pool is large. When leadership transitions, we overlay the new pool atop the old one before stopping the old, so workflows never stall mid-execution.
Any pod can take on either role at any point in time, so no pod is special. The leader can die and a follower takes over, and a follower can be promoted and resized without anyone planning for it. That makes the connection and the execution layer independent failure domains. The connection is protected by leader election. Workflow execution is protected by redundant workers. Each can fail and recover independently.
Temporal for durable execution
Allocating capital autonomously means walking one inquiry through a sequence of systems, where each step depends on the one before it and some of them change state:
- Receive the inquiry and translate it.
- Fetch current market data and pricing.
- Check regulatory constraints.
- Reserve capital.
- Send a response.
- Wait for the protocol to acknowledge and confirm.
- Accept or cancel based on the outcome.
Each of these steps is a remote call and idempotent, so retrying one is safe. Each can still time out, fail, or return an error, and the process running the sequence can die between any two steps. If it dies after capital is reserved but before the response goes out, something has to remember that the reservation exists and either finish the flow or unwind it. Writing this as a hand-rolled state machine means persisting state after every step, resuming from the right place on restart, and handling every partial failure by hand. That's a recipe for subtle bugs.
Temporal takes that over. It persists each workflow's progress as an event history, so when a pod dies mid-flow another worker picks the workflow up and continues from the last completed step. Each step is an activity with its own timeout and retry policy, which is what lets us treat different kinds of failure differently.
Distinguishing business failures from infrastructure failures
Temporal lets us express the difference between a transient error (retry) and a business error (don't retry).
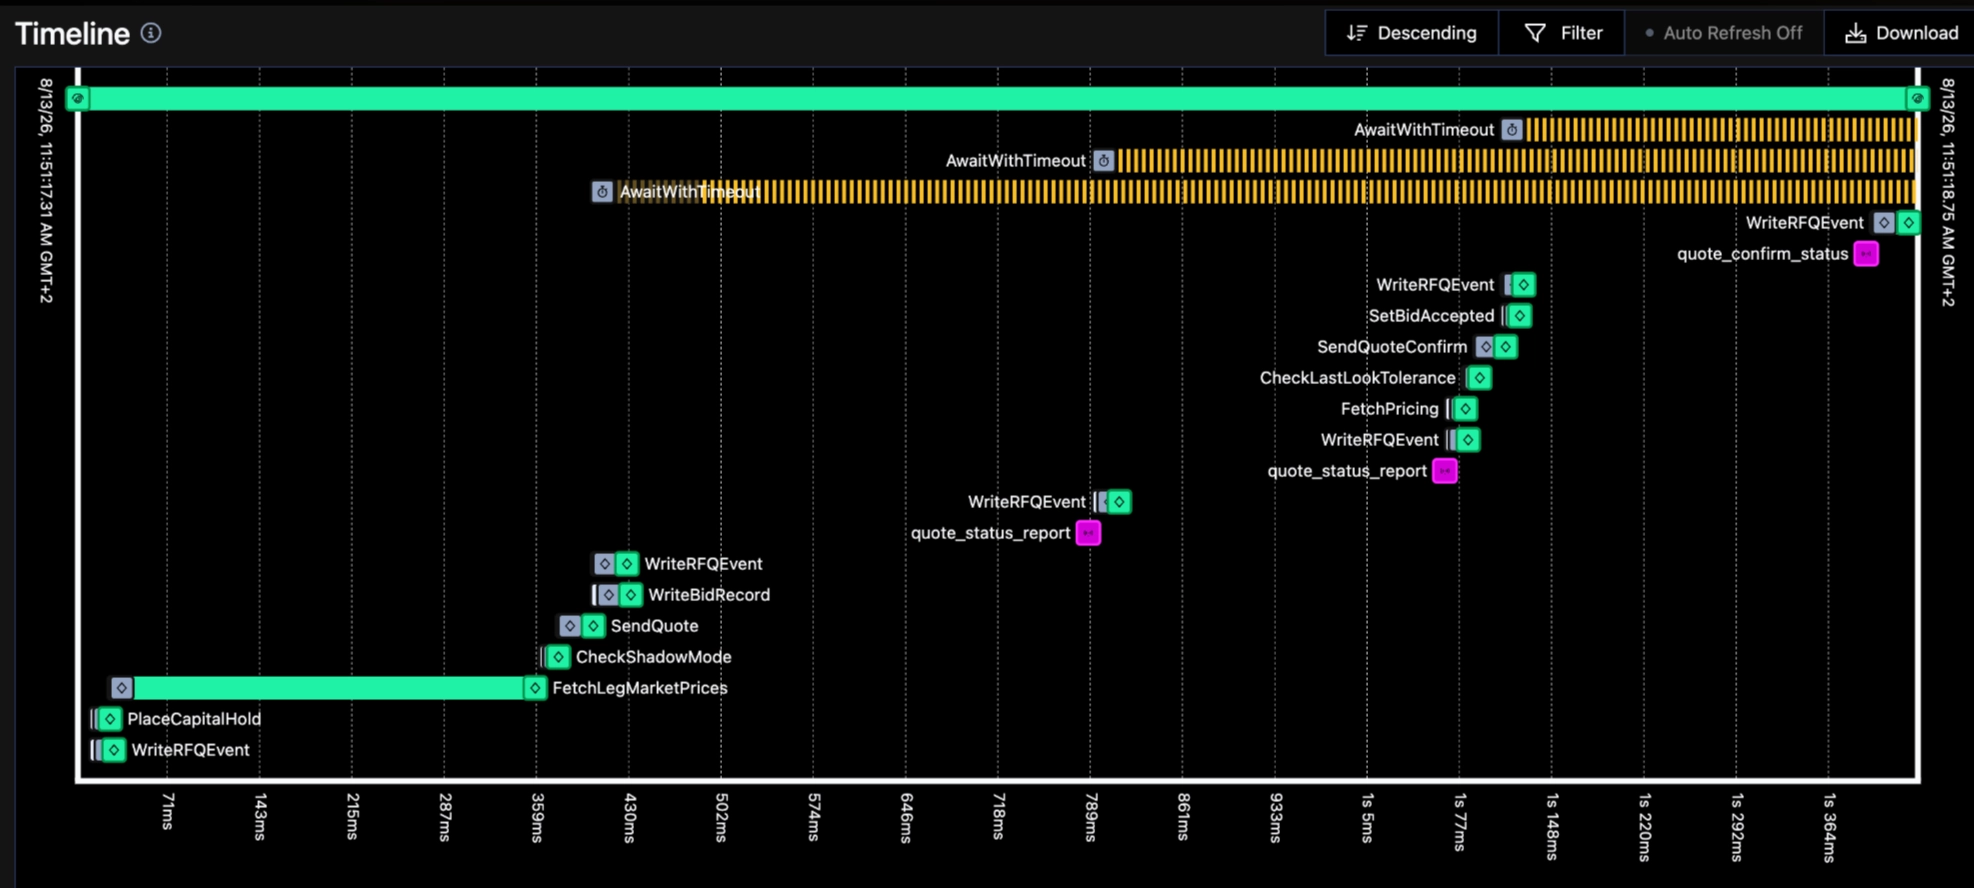
When an activity encounters a budget-exhausted condition (we've already placed all the quotes we're allowed to place today), it returns a NonRetryableApplicationError. Temporal sees this and stops retrying immediately. The workflow continues, but it knows it's a business decision, not a transient network glitch.
Blind retries are dangerous when money is involved. A transient timeout might resolve in 100ms. A business constraint is permanent until human decision-makers change the system configuration.
Priority queues
Not all workflow activities are equally urgent. A real-time quote request from a customer must execute before a background audit job. But how do you ensure that without manually prioritizing every job?
Temporal's task queue design lets you run multiple workers with different queue affinities. High-priority work goes to a dedicated queue and dedicated workers. Background tasks go to another. When CPU is contended, workers drain the high-priority queue first, then move to lower-priority work if capacity allows.
If you've accepted a customer quote, you must execute the confirmation within a tight window or the exchange rejects it. A background reconciliation job can wait. By routing these workflows to different queues with different worker sizing, you make the implicit priority explicit and measurable.
The immutable audit trail
Every event in the ecosystem is written to an immutable audit log. This log lives in cold storage partitioned by date and query-able.
An autonomous system spending real money needs an immutable, queryable record of every decision it made and why it made it. Six months later, if there's a dispute about whether a quote was valid or capital was properly reserved, you can reconstruct the exact state of the system at that moment. This record is a regulatory and operational necessity.
What do these raw logs look like?
# Initial message we receive
{
  "request_id": "f06c3c38-b976-4463-aa6f-2c6bd06db561",
  "event_id": "ec754868-31a4-4a25-a647-3c9912228d07",
  "event_type": "quote_request",
  "schema_version": 1,
  "timestamp": "2026-09-06T08:35:50.782998337Z",
  "observed_at": "2026-09-06T08:35:50.715500132Z",
  "shadow": false,
  "fix_envelope": {
    "begin_string": "FIXT.1.1",
    "msg_seq_num": 36374,
    "sending_time": "2026-09-06T08:34:39.31Z",
    "check_sum": "080"
  },
  "payload": {
    "quote_id": "b93966c3-f85c-4436-a0db-27c38e7a709c",
    "quote_req_id": "f06c3c38-b976-4463-aa6f-2c6bd06db561",
    "symbol": "KXMVECROSSCATEGORY-SHARD1-S2026CB42E36B5CA-BF132062B15",
    "order_qty": 0,
    "cash_order_qty": 10,
    "party_id": "a2bd69ff430227d9270f2648924419235d11ebc4c2ab352e5211c66931aabeb7",
    "multivariate_collection_ticker": "KXMVECROSSCATEGORY-SHARD1-R",
    "legs": [
      {
        "ticker": "KXATPMATCH-26SEP06MEDTIA",
        "market": "KXATPMATCH-26SEP06MEDTIA-TIA",
        "side": "yes"
      },
      {
        "ticker": "KXATPMATCH-26SEP06MICETC",
        "market": "KXATPMATCH-26SEP06MICETC-MIC",
        "side": "yes"
      },
      {
        "ticker": "KXATPMATCH-26SEP06PAUALC",
        "market": "KXATPMATCH-26SEP06PAUALC-ALC",
        "side": "yes"
      },
      {
        "ticker": "KXATPMATCH-26SEP06SHETSI",
        "market": "KXATPMATCH-26SEP06SHETSI-SHE",
        "side": "yes"
      }
    ],
    "collection_ticker": "KXMVECROSSCATEGORY-SHARD1-R",
    "leg_count": 4,
    "collection_internal_id": "",
    "leg_internal_ids": null
  }
}

# pricing data that we extract
{
  "request_id": "f06c3c38-b976-4463-aa6f-2c6bd06db561",
  "event_id": "66c992c1-b1cb-4cab-b889-753eb1350983",
  "event_type": "quote_leg_market_prices",
  "schema_version": 1,
  "timestamp": "2026-09-06T08:35:50.782998337Z",
  "observed_at": "2026-09-06T08:35:50.719163982Z",
  "shadow": false,
  "payload": {
    "quote_id": "b93966c3-f85c-4436-a0db-27c38e7a709c",
    "market_tickers": [
      "KXATPMATCH-26SEP06MEDTIA-TIA",
      "KXATPMATCH-26SEP06MICETC-MIC",
      "KXATPMATCH-26SEP06PAUALC-ALC",
      "KXATPMATCH-26SEP06SHETSI-SHE"
    ],
    "pricing_by_ticker": {
      "KXATPMATCH-26SEP06MEDTIA-TIA": {
        "ticker": "KXATPMATCH-26SEP06MEDTIA-TIA",
        "bid_dollars": "0.4000",
        "ask_dollars": "0.4100",
        "last_price_dollars": "0.4000",
        "timestamp": "2026-09-06T08:34:03.766Z"
      },
      "KXATPMATCH-26SEP06MICETC-MIC": {
        "ticker": "KXATPMATCH-26SEP06MICETC-MIC",
        "bid_dollars": "0.7200",
        "ask_dollars": "0.7300",
        "last_price_dollars": "0.7300",
        "timestamp": "2026-09-06T08:32:57.38Z"
      },
      "KXATPMATCH-26SEP06PAUALC-ALC": {
        "ticker": "KXATPMATCH-26SEP06PAUALC-ALC",
        "bid_dollars": "0.8200",
        "ask_dollars": "0.8300",
        "last_price_dollars": "0.8300",
        "timestamp": "2026-09-06T08:35:23.864Z"
      },
      "KXATPMATCH-26SEP06SHETSI-SHE": {
        "ticker": "KXATPMATCH-26SEP06SHETSI-SHE",
        "bid_dollars": "0.6800",
        "ask_dollars": "0.6900",
        "last_price_dollars": "0.6900",
        "timestamp": "2026-09-06T08:33:18Z"
      }
    }
  }
}

# price we submit
{
  "request_id": "f06c3c38-b976-4463-aa6f-2c6bd06db561",
  "event_id": "ee99b09a-3538-4a54-b4d5-d25183f4a813",
  "event_type": "quote_pricing_result",
  "schema_version": 1,
  "timestamp": "2026-09-06T08:35:50.782998337Z",
  "observed_at": "2026-09-06T08:35:50.719163982Z",
  "shadow": false,
  "payload": {
    "quote_id": "b93966c3-f85c-4436-a0db-27c38e7a709c",
    "call_type": "initial",
    "order_qty": 10,
    "yes_bid": 0.0,
    "no_bid": 0.57
  }
}
Resource allocation by role
Most systems have two layers of scaling that should be tuned independently: cluster-wide capacity and per-process concurrency. Confusing them is a common source of cascading failures.
Inside each process, you run a concurrency model: threads, async workers, goroutines. In a system with leader election, this concurrency should scale with role.
The leader is running the singleton connection and the critical path. It needs CPU for that connection's polling loop, not for general request handling. Followers don't have that constraint. So a follower runs a large worker pool; the leader runs a smaller one.
When leadership transitions, the new leader's worker pool must resize live, without stalling mid-flight work. This requires overlaying the new configuration atop the old before tearing down the old. Workflows and jobs must never see the queue go unpolled.
The worker count itself should be visible in your observability layer, as a metric, labeled by the process's role. When something goes wrong, you can see "what was this process doing, and how many workers did it have?"
Instrumentation at every boundary
You cannot manage what you cannot see. In an autonomous trading system, you need visibility into every decision point and every external call.
One observability convention, enforced
Pick one observability framework and use it everywhere. This buys you two things: (1) engineers don't have to learn multiple instrumentation APIs, and (2) when you're debugging a problem that spans multiple services, you see a continuous trace, not a collection of isolated logs.
For us, that is OpenTelemetry for instrumentation and the Grafana stack behind it:
- Metrics go to Prometheus.
- Logs go to Loki.
- Grafana is where we look at all of it.
- Alerts are connected to incident.io, which pages the on-call engineer when something breaks.
Instrument where it matters
Don't instrument every line of code. Instrument at the boundaries:
- External connections: every message sent to an exchange, every API call, every database query. Tag it with what happened (success, timeout, error code). This is how you know if the system is talking to the world correctly.
- Orchestration layer: if you're using a workflow system, use its SDK's built-in tracing. Don't hand-roll spans. The SDK already knows about retries, timeouts, and task dependencies, so it captures that for you.
- Business logic: custom counters for the domain. These are the metrics that tell you if the system is working, not just running.
We build dashboards at two levels. Every system gets its own detailed dashboard, and there are high-level observability dashboards that show the health of the whole platform. The high-level ones tell you something is wrong. The per-system ones tell you what.
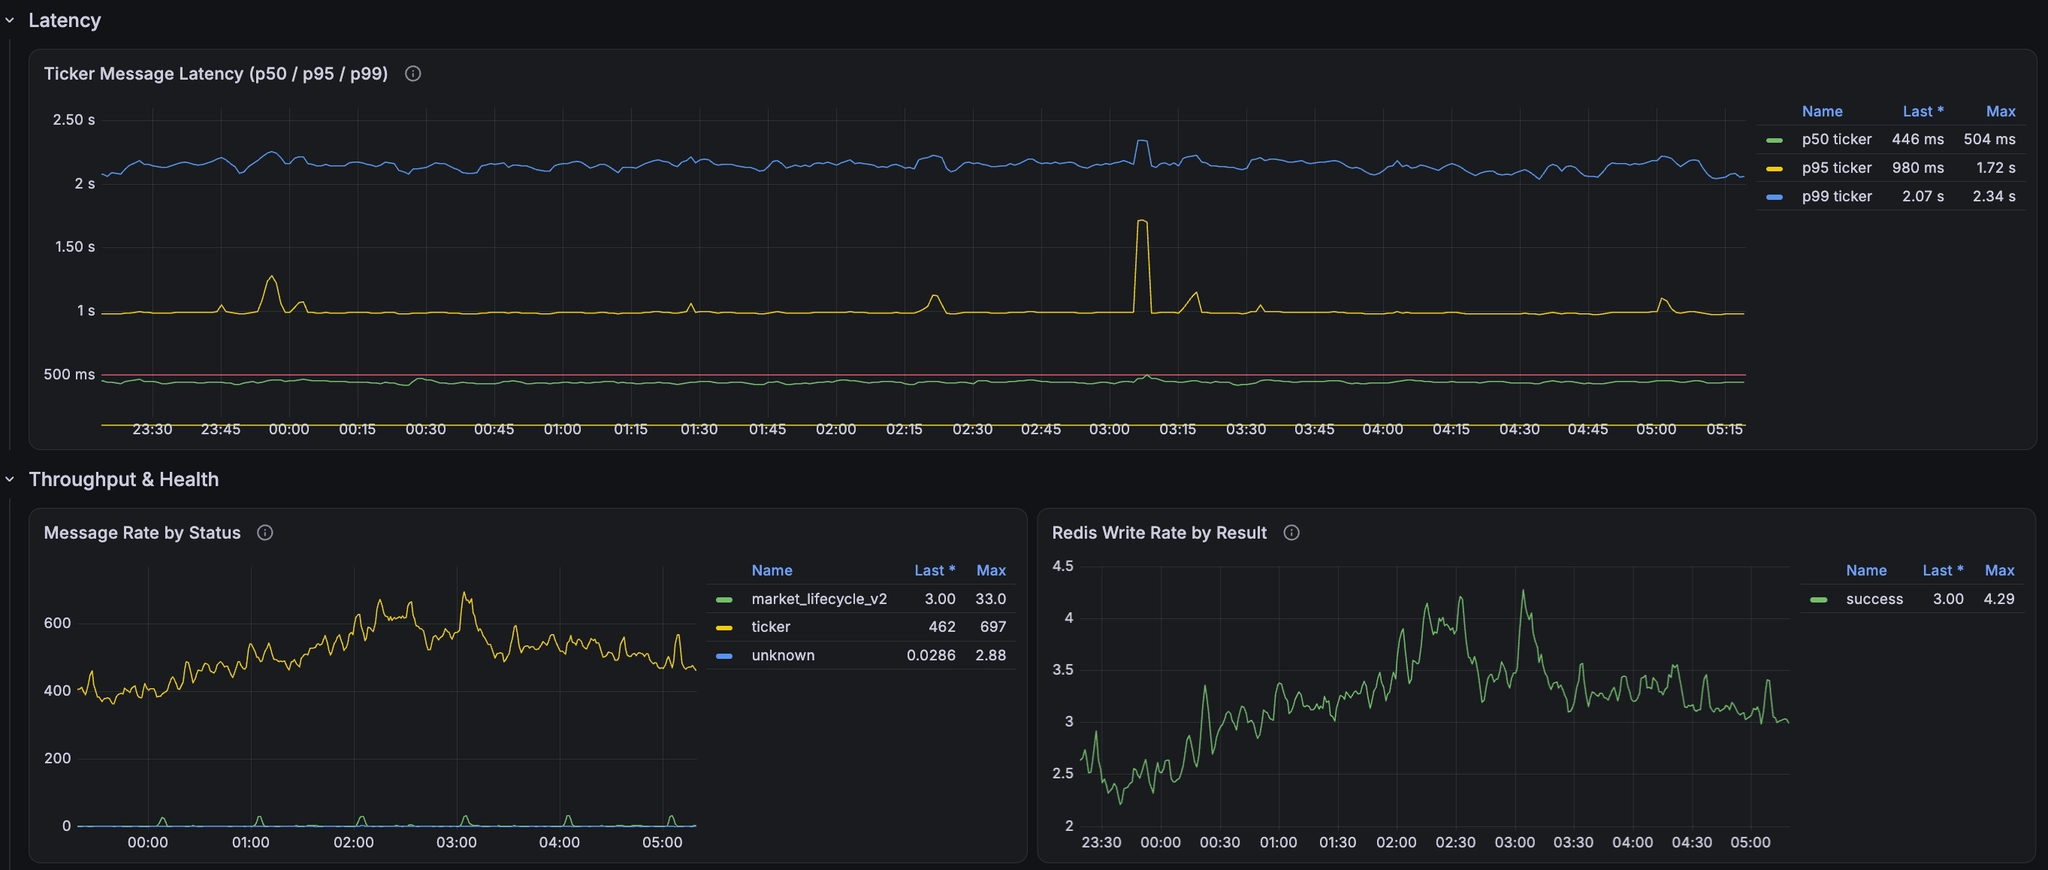
A per-system dashboard: ticker message latency (p50 / p95 / p99), message rate by status, and Redis write rate by result.
Deriving metrics from traces
Your metrics (rate, errors, duration, percentiles) should come from your traces, not from hand-coded instrumentation. This means you instrument once. One source of truth. When you add a new piece of business logic, you don't need to remember to add a counter; the trace span already has the duration and success/failure status.
This solves a common drift problem: after six months, business logic changes, but the hand-coded metric definition never gets updated. Trace-derived metrics can't drift.
Alerting and dashboards as code
Dashboards clicked together in a monitoring UI are not observable systems, they're wallpaper. The moment you redeploy, someone changes a threshold because they don't understand it, or the dashboard gets deleted by accident. Treat alerting and dashboarding like code.
Dashboards and alerts live in the repository
Dashboard definitions belong in version control, alongside the code they monitor. When you ship a code change that might affect latency or error rates, you also ship an updated dashboard in the same PR. The engineer who knows the system best, the one who wrote it, is the one defining how to look at it.
This does two things: (1) dashboards stay current with the code, and (2) the next person on-call can read the PR history to understand why a threshold is set to 50ms instead of 100ms.
Shipping changes safely
Once you have infrastructure and observability in place, the hard part begins: how do you change the system without breaking it?
In a system that moves real capital, you cannot afford a "move fast and break things" mentality. But you also cannot afford to be so cautious that the system stagnates.
Decouple deployment from activation
Feature flags let you ship code that is inert. A PR that changes pricing logic can be merged and deployed without affecting production. The new code is in the binary, but a flag controls whether it runs. Flip the flag only after reviewing logs and metrics.
You deploy the code on Monday. You watch it on Tuesday. You run shadow analysis on Wednesday. You flip the flag on Thursday.
Shadow mode: test against real data without executing
In pricing systems, the most dangerous bugs are the subtle ones. A pricing formula that's off by 1% looks identical to the correct formula until you've executed a thousand trades and lost real money.
Shadow mode means: run the new logic in parallel with the old logic against real customer requests, but only execute the old logic. Log both decisions. Compare. Look for divergence. If the new logic consistently quotes 2% higher than the old logic, you've found a bug before it cost you anything. Only after the shadow run stabilizes do you flip the execution flag.
Graceful shutdown: don't orphan in-flight work
When you deploy a new version, the old processes don't get forcibly killed. They receive a shutdown signal, then wait for any in-flight work to complete. A pricing request arrives at a pod that's about to shut down? The pod finishes the activity, then exits cleanly.
This means deploys don't cause request loss. The trade doesn't disappear into the void because a pod restarted.
Durability is systemic
Durability doesn't come from a single technology or pattern. It emerges from all these mechanisms reinforcing each other.
Leader election protects singleton connections. Workflow orchestration with priority queues protects business logic execution. Observability (traces, metrics, dashboards) lets you see what's happening. Alerting lets you respond when something breaks. Infrastructure as code means configuration is reviewable and reproducible. Feature flags let you validate changes on real data. Graceful shutdown means deployments don't lose work. And an immutable audit trail means you can always reconstruct what happened.
Each mechanism stands alone, but together they form a system where:
- Failure modes are visible before they become crises
- Every decision, configuration, and operation is logged and auditable
- Changes are validated on real data before committing
- Components degrade gracefully instead of cascading into total failure
Autonomous systems that move capital require more than clever algorithms. They require infrastructure that you trust to do the right thing when you're not watching. That trust isn't earned by claims; it's earned by building systems so transparent, so instrumented, and so designed to fail safely that you can confidently write code that spends money without human approval.
That's the bar for durability.
Waco Holve is a Senior Machine Learning Engineer at PrizePicks.
If you are a free agent looking to get drafted to an Engineering team that solves real world problems like this in-house, explore our open positions below.